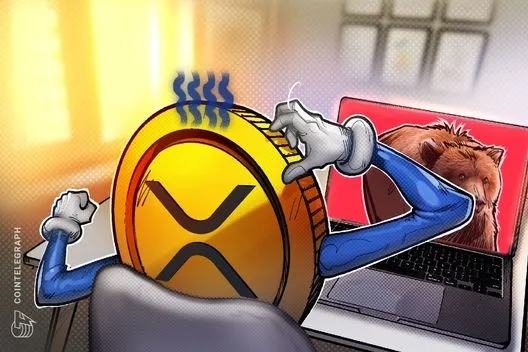
XRP is navigating turbulent waters as emerging technical indicators suggest a significant risk of its price plummeting below the key $1 threshold in the near term. Recent chart patterns, including head-and-shoulders formations and bear flags, are painting a bearish outlook for the popular cryptocurrency.
Bearish Patterns Emerge
Since June 5, the XRP price has exhibited a head-and-shoulders (H&S) pattern, a classic bearish chart formation that signals potential declines. This setup comprises three peaks with the central peak—termed the 'head'—rising above two 'shoulders'. Breakdowns often occur when prices breach the neckline support, typically forecasting substantial declines.
As it stands, XRP appears to be developing the right shoulder of this pattern, with initial support near $1.09. Should the price dip below this level, the downside target could hover around $0.99—a roughly 10% decline. Conversely, a breakthrough above the right shoulder peak at approximately $1.12 could negate this bearish indicator, allowing XRP to ascend toward the 50-period exponential moving average at around $1.15, representing a potential recovery of about 4.5%.
Bear Flag Adds to the Downward Pressure
Adding to the troubling signs, XRP’s four-hour chart reveals a bear flag, reinforcing the likelihood of further price declines. This formation materializes following sharp sell-offs and indicates possible consolidation within a rising channel before a retracement. Currently, XRP is testing the lower trendline of this bear flag near $1.10. A decisive close below this threshold could confirm a bearish breakdown, with estimates projecting a price target around $0.94, reflecting a 15% decline from current levels.
On-Chain Indicators Highlight Weak Demand
Further complicating the picture, on-chain metrics such as the market value to realized value (MVRV) bands suggest XRP could dip toward the significantly lower green zone, historically associated with waning demand or capitulation among traders. When prices approach the lower bands, it often signifies industry stress. The last time XRP hovered in this territory, it was seen during major downturns in previous years, indicating the potential for another substantial drop to around $0.96—a level approximately 13% below the current price.
As market participants absorb these developments, traders are cautioned to closely monitor XRP's resistance and support levels. The prevailing sentiment hints at vulnerability, with potential price movements poised to impact investor sentiment as the cryptocurrency landscape continues to evolve.
More Recommended

Divided We Stand: Shifting Dynamics in the Crypto...

Strategy Halts Bitcoin Purchases Ahead of Earnings...